Long range over loaded flying always has the risk of going down and not surviving.
But it pays better than working for a FTU.
Moderators: Sulako, Right Seat Captain, lilfssister, North Shore, sky's the limit, sepia


It's important to know the limitations of looking at graphs like these or you can come to some false conclusions. Because the graph slides left/right and changes shape (somewhat) as the power changes, it's not fair, and could be misleading, to compare points on the drag curve with different power settings. (I mentioned that, but maybe didn't make the point strongly enough.)Photofly -- I am very confused.
The main discrepancy I see in your graphs is that the relationship between the speeds along the horizontal access is not in the proper order
In a propellor driven air craft the relationship between speeds should be as follows (slowest to fastest):
1. Minimum power required/max endurance/minimum sink glide
2. Vx
3. Minimum drag/max range/best glide
4. Vy
Your graphs show Vx as slowest, followed by Vy and Minimum sink together -- the two aren't directly correlated like this -- and then best glide


Do you mean you never sat in and actually watched?Cat Driver wrote:WTF do they talk about for all that time?
Colonel, always.work with me.
No, no - there absolutely is. They don't tell you that in "From the ground up", but there totally is. It's not vastly different, but different enough. That's extremely important to understand in the context of this discussion. See Denker, here:There is not a separate "power on" and "power off" curve.

Well actually when I first started the school I took an active interest in how they taught but eventually I came to the conclusion it was counter productive for me to become involved in how they taught flying.Do you mean you never sat in and actually watched?
My mistake and apologies, I had assumed you were also the CFI of said school. Since this was not the case I am interested in hearing how it was set up, but that can be asked and answered somewhere else since its starting to get well outside the scope of this thread.Cat Driver wrote: Well actually when I first started the school I took an active interest in how they taught but eventually I came to the conclusion it was counter productive for me to become involved in how they taught flying.
My problem was two fold, because I did not hold an instructors rating they would not accept any of my suggestions and the second problem arose when T.C. phoned me and informed me that there were complaints from unidentified instructors that I was interfering in flight training and if I did not cease and desist from interfering they would suspend my FTU-OC .
I eventually did the smart thing and sold the flight school.
At least its a topic for discussion, I'd much rather see people discussing the finer points of the power curve and actual flying techniques than the usual things that pervade flight training these days. Again, another discussion, another time.Cat Driver wrote:By the way Shiny, I do enjoy watching the mental masturbation that goes on here in this forum hopefully this gang are good enough hands and feet pilots to actually fly to those fine limits.
Unfortunate it was that way, and again I'd be interested in hearing about how it became that way. I'll reserve comment for then.If I can think of even one of the instructors I had in my school over the six years I owned it who could fly that accurately I'll get back to you.
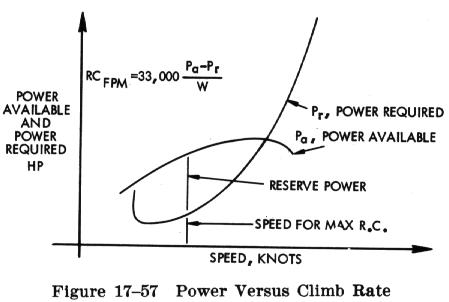
The graph I drew way-back for power-on climb rate is based on the engine providing constant power at all air speeds of interest, which would make the power available curve a flat line (I did draw a dotted line marked "full power", to make it explicit) and then the excess-power available curve has the same shape as the drag curve. That approximation is probably best for a constant-speed prop, less good for a fixed pitch prop, and lousy for a turbojet.Trematode wrote:Photofly -- I think I see where you are coming from. If you are refering to 7.5.2 in see how it flies, I think he is dead wrong.
It looks like he's forgone the traditional power required vs. available cruves, and drawn a single "excess power" curve. If that's what he's done, he is correct in noting that the high point of this curve is Vy, however -- he seems to make a logical leap and assume it is also equivalent to the minimum sink speed. This isn't right because excess power isn't the inverse of power required. You need to plot it against the power available to find it.
If he has simply flipped the power required curve upside down, then he's right about minimum sink, but WRONG about Vy.
For some nice graphs that will illustrate how denker is wrong, and how Vy is not the lowest point on the power required curve: http://www.boundvortex.com/ReadArticle. ... ticleID=55.
Photofly, you are making a couple mistakes here:The graph I drew way-back for power-on climb rate is based on the engine providing constant power at all air speeds of interest, which would make the power available curve a flat line (I did draw a dotted line marked "full power", to make it explicit) and then the excess-power available curve has the same shape as the drag curve. That approximation is probably best for a constant-speed prop, less good for a fixed pitch prop, and lousy for a turbojet.
But the power available curve is anything but flat: Look at the bottom of the two diagrams I posted -- the power required vs. power available curves.So yes, Vy isn't the lowest point on the power-required curve, it's where the "power available curve" is highest above the "power required" curve. But if the the power available curve is a flat line then it's the same thing.
NO. Vx again is a function of thrust available vs. total drag -- the power curves have nothing to do with Vx except that we know Vx lies somewhere between minimum power required, and the tangent.Are you happy now that to determine Vx (and best glide distance) it's appropriate to look at the tangent line to the "excess power available" curve?
No, you can't. Which was my point. Vx and Vy are heavily dependant on the engine, and type of propulsion. You need to know thrust available, and power available -- two different things.I take your point about looking at excess thrust curves to do that, but you can also look at them on the power curves, which lets you tie Vx to Vy, and best glide (distance) to best glide (time).
Nope... don't believe I am ...Trematode wrote: Photofly, you are making a couple mistakes here:
Absolutely you can. The connecting factor is the propeller efficiency, η. As Wikipedia correctly has it:You can't conflate brake horse power being generated by the engine with the "power" we are talking about with these curves.
Indeed it's not....Important thing to note is that thrust is not the same as power.
By drag curve, I mean the rate of loss of energy due to drag. That's a measure of power required to maintain unaccelerated flight. It's drag time airspeed. I do know and the difference between a power and a force, trust me.So which are you talking about here when you say power available is the same as the drag curve?
Well that's just a sketch, to illustrate a point. Let's look at a real graph, like figure 23, for a constant speed prop, from this 1947 NACA report entitled Prop Efficiency Charts for Light Aeroplanes": http://www.engbrasil.eng.br/index_arquivos/art10.pdf.But the power available curve is anything but flat: Look at the bottom of the two diagrams I posted -- the power required vs. power available curves.
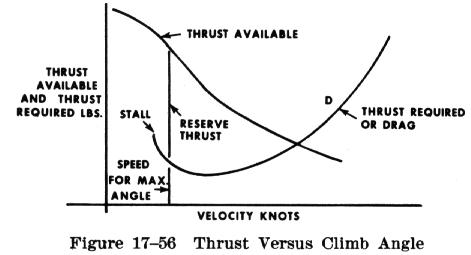
Actually all the Colonel's graph showed was:See also the Colonel's graph in his earlier post, complete with tangent lines to show best angle.

Well, what is Vbr if not an airspeed determined by maximizing or minimizing an angle of flight? And lo, there we are, finding it by drawing a tangent to a graph of power vs. airspeed. Just do the same exercise while the engine is producing power, using the excess power curve. Lo and behold, you just drew Vx on a power vs. airspeed graph. No need to draw a thrust graph.Actually all the Colonel's graph showed was:...
Vbr == Best Range, and how it has to increase with a 30 knot headwind.
I'm sorry, but your argument (which consists of "you will see...." ) is wrong - you quite simply can.then you will see you cannot find Vx by plotting the tangent against a curve that measures a rate.
Here's the flaw in your argument. The excess power curve tells you everything about the excess thrust, because excess power is simply excess thrust multiplied by the airspeed. (That's a basic definition in physics.) When you take the gradient you divide the vertical measure by the horizontal - you divide the power by the airspeed - removing the extra factor of velocity that's worrying you. That's a wishy-washy hand-waving way to get you to think about what the concept of a gradient means. The solid maths is on the page I scanned above.My issue with what you're saying, photofly -- that you can use the power required curve to find Vx -- is that the power required curve measures a rate. It tells us nothing about the forces of drag or thrust directly.
Hallelujah. Yes. We're talking about "excess power" curves. All the way along.Trematode wrote:Bear with me, as now I'm even more confused.
Are you talking about an "excess" power curve now? I don't disagree that you would be able to find Vy at the top of this curve, and Vx at the tangent.
But Before we were talking about the single power required curve -- not an excess power curve.
You can think of the drag(power) curve as an "excess power" curve of sorts. The excess is always negative, so you're never climbing, but it's the same idea, and the curve has the same basic shape, just in a different place. So I maintain that yes, you can get the information about glide speeds from an excess power curve - specifically, the one you get when the engine's producing no power.And if you are plotting an excess power curve you aren't going to get the information about the glide speeds, correct?
I agree that it would do, if the drag didn't depend somewhat on angle of incidence etc, and if the power produced by the engine was independent of airspeed. (You rightly pointed out that's not a great assumption). Earlier I wrote that the minimum sink speed for the 172 is less than 74mph while Vy is 90mph - not really very close to each other. The very simple theory doesn't produce very realistic results, for sure. Denker admits as much.Trematode wrote: Re: see how it flies, and denker's depiction of the power curve: Is he describing an excess power curve as well? If it is, do you agree with his assertion that Vy occurs at the same speed as minimum sink?
I wasn't very clear to begin with, that in the graphs I was assuming a constant power output independent of airspeed from the engine, because I hadn't really thought about whether it was ok to assume that.I may have been focused too much on the diagrams you posted initially, and was interpreting them incorrectly.
Vy and minimum sink have a kind of correspondence, both being found at the top of the respective relevant curve, but no, they don't in reality occur at the same speed. Vx and best glide aren't equivalent because Vx is slower than Vy, and best glide is faster than min sink, but you can find each of them by using the same method of drawing the relevant tangent line on the relevant graph.To clarify: Are you saying Vy and minimum sink are equivalent? That Vx and Best Glide are equivalent? Or were you just saying that you can find them in similar fashions by plotting them on separate curves and noting the high/low points of the arc and tangents?

|
Use AvCanada's information at your own risk!
We reserve the right to remove any messages that we deem unacceptable.
When you post a message, your IP is logged and may be provided to concerned parties where unethical or illegal
behavior is apparent.
All rights reserved.
